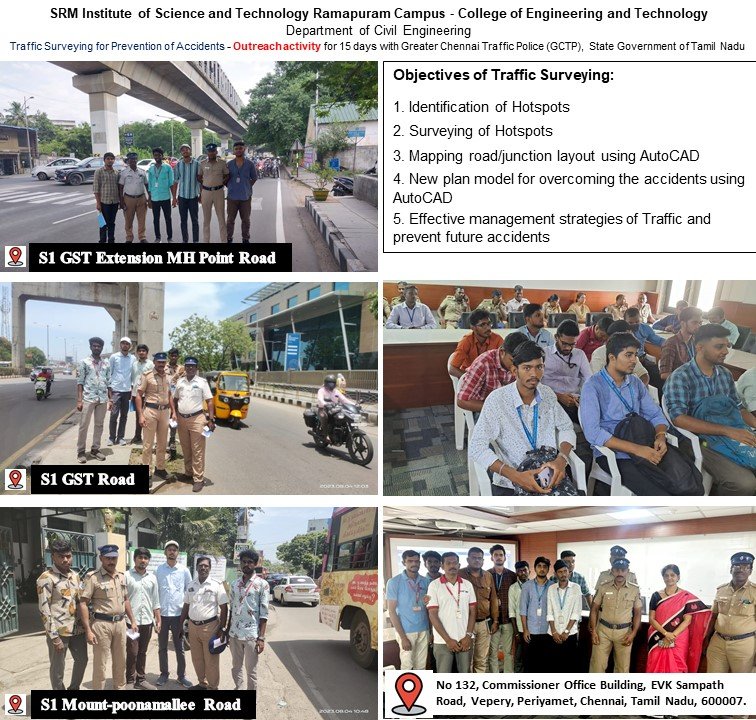
Figure 1: Inaugural day training for carrying out Traffic Surveying 5 students of B.Tech Civil Engineering Sarathchandiran R, Jagathratchajan N, SelvaBalaji S, Sivamani M G and Senthil Kumar A along with Faculty coordinates
Objectives of Traffic Surveying:
- Identification of Hotspots
- Surveying of Hotspots
- Mapping road/junction layout using AutoCAD
- New plan model for overcoming the accidents using AutoCAD
- Effective management strategies of Traffic and prevent future accidents
Inaugural of Program on surveying of Traffic for accident prevention:
The inauguration of outreach program on traffic survey at identified hot spots in Chennai prone to accidents was inaugurated at the commissioner’s office on 1st Aug 2023 by the Deputy Commissioner – Traffic police Thiru. Radhakrishnan. Assistant commissioner – Traffic police, Thiru. Baskaran, given welcome address and started session. Students were accompanied and mentored by Dr.T.Ch.Madhavi, Professor and Dr.P.R.Kumaresan, Assistant Professor. It was elaborated about traffic surveying and how to report in Mobile App. Five selected students carried Sarathchandiran R, Jagathratchajan N, SelvaBalaji S, Sivamani M G and Senthil Kumar carried out Traffic surveying for next 15 days and covered areas in and around Guindy with support of officers from Traffic police, Chennai Corporation, Highways and ambulance service
108. Finally a safe and suitable Traffic planning and road design which complex tasks are submitted with expertise in traffic engineering and urban planning. We are happy to do collaborative work with Greater Chennai Traffic Police (GCTP).
Figure2:Traffic Surveying Field photographs
Hotspots:
The hotspots are specific locations on roadways where there has been a significantly higher number of severe traffic accidents resulting in fatalities or severe injuries, such as the loss of limbs or immediate fatalities, over the past three years. These incidents are considered hotspots due to their alarming frequency and severity. The occurrence of such severe accidents can be attributed to a variety of factors including road design, traffic flow patterns, driver behavior, weather conditions, and other contributing factors. Identifying and addressing these hotspots is crucial for enhancing road safety and preventing further loss of life and severe injuries.
Study area:
Chennai South – Guindy to St. Thomas Mount corridor is chosen. More than 30 hotspots were identified between the Guindy to St. Thomas Mount corridor. Traffic surveying for particular hotspots were carried out.
Surveying of Hotspots:
Physically the hotspots were visited for 15 days along with surveying team consisting of traffic constable, Engineer form highways department, Engineer from Greater Chennai Corporation (GCC), Driver from 108 ambulance. The reason for past fatalities was identified. The road junction is surveyed using tools such as Tape and compass in order to check the length, breath and sings are properly visible for the user. Measure traffic volumes, congestion, and peak hours to identify areas with high traffic density that might lead to accidents. Survey pedestrian and cyclist movement to ensure their safety and identify potential conflict points with vehicles. The survey analysis include factors that might contribute to accidents, such as poor visibility, complex intersections, inadequate signage, or challenging road design.
Mapping road/junction Layout using AutoCAD
Mapping road and junction layouts using AutoCAD can be a valuable step in understanding and addressing road accident hotspots to create accurate and detailed drawings of roadways, intersections, and other infrastructure.
New plan model for overcoming the accidents using AutoCAD
Based on our analysis, propose potential solutions to address the identified hotspots. This might involve suggesting changes to road design, signage improvements, traffic calming measures, or other safety enhancements. As new data becomes available or changes are implemented, update your AutoCAD drawings/Layout to reflect the current road conditions and accident patterns.
Effective management strategies of for accidents and prevent future accidents
Conduct thorough traffic surveys to gather data on traffic patterns, driver behaviour, and road conditions. This information is crucial for understanding the current state of road safety and identifying areas prone to accidents. Utilize AutoCAD to create detailed and accurate road layouts and drawings. These drawings provide a visual representation of road conditions, helping to identify potential hazards and implement safety measures:
- Identify Root Causes:Analyse the survey data and AutoCAD drawings to identify the root causes of accidents, whether they’re related to road design, driver behavior, or other factors.
- Prioritize Interventions: Prioritize areas with the highest accident rates or those with the potential for severe accidents. Focus on intersections, high-traffic zones, and areas where accidents involving pedestrians and cyclists are common.
- Implement Safety Measures:Based on your analysis, propose safety measures such as traffic calming techniques, improved signage, better lighting, pedestrian-friendly infrastructure, and changes to road design.
- Simulation and Modelling: Use AutoCAD to create simulation models that visualize the effects of safety interventions before implementing them. This can help in evaluating different scenarios and selecting the most effective solutions.
Last but not the least involve local communities, advocacy groups, and relevant authorities to ensure that proposed safety measures address their concerns and needs. Create awareness to public, school and college students to avoid accidents and strict following of Traffic rules. The AutoCAD Layout diagrams, GPS points (latitude and longitude) along 27 others question regarding the road junction is updated in the Field Survey App – Mobile application managed by GCTP.


